GBP/USD Monthly Review: Forecasts from April 2023 onwards

Обзоры рынка
The GBP/USD has a subdued outlook today, with April house price data in focus, although inflation and central bank policy will likely dominate market attention. UK retail sales figures showed economic resilience, with a 5.2% increase in the BRC Retail Sales Monitor for April, surpassing the predicted 4.7% growth.
Despite the positive UK data, global recession fears led to heightened interest in China's trade numbers. China's dollar trade surplus expanded from $88.19 billion to $90.21 billion in April, well above the expected $71.60 billion. Imports dropped by 7.9% YoY, while exports increased by 8.5%, causing demand concerns due to the larger-than-anticipated import decline.
No economic indicators are scheduled for release later today, and no Monetary Policy Committee members are set to speak, so media commentary will likely influence the GBP/USD. This morning, the currency pair was down 0.01% at $1.26161.
What Do Technical Indicators Say?

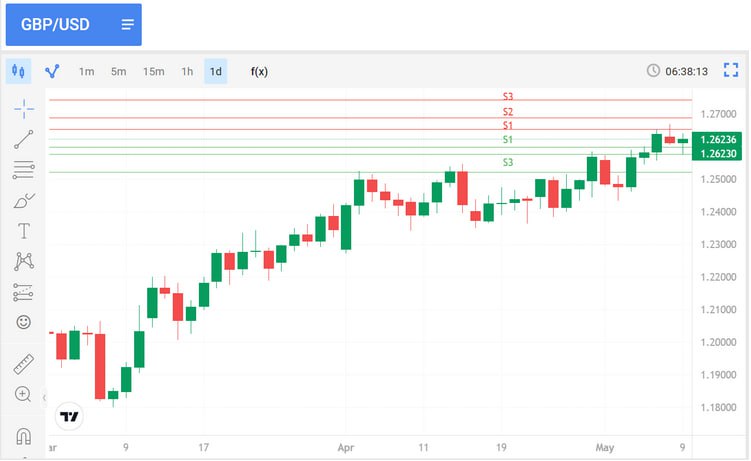
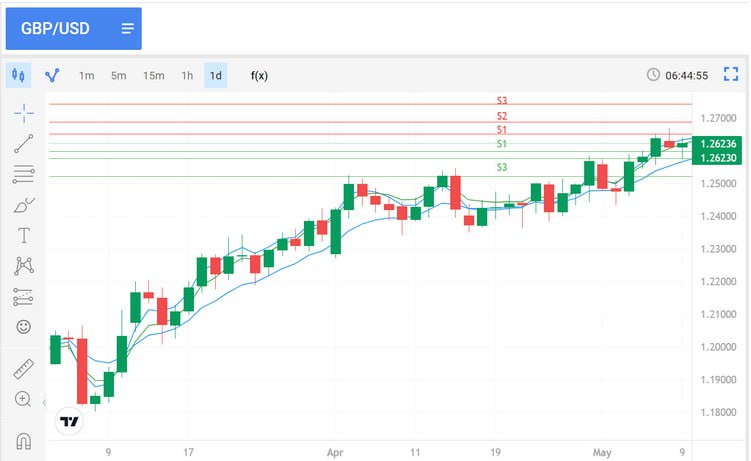
For an extended breakout session, the Pound needs to surpass the $1.2633 pivot and target the First Major Resistance Level (R1) at $1.2653 and Monday's high of $1.26686. A supportive risk-on sentiment is necessary for a breakout session. In case of an extended rally, the GBP/USD could test the Second Major Resistance Level (R3) at $1.2689 and the Third Major Resistance Level at $1.2744.
Failing to breach the pivot would put the First Major Support Level (S1) at $1.2597 into play. However, unless a risk-off sell-off occurs, the GBP/USD should stay above $1.2550, with the Second Major Support Level (S2) at $1.2577 limiting the downside. The Third Major Support Level (S3) is at $1.2522.

The EMAs on the 4-hourly chart convey bullish signals, with the GBP/USD above the 50-day EMA at $1.25548. The 50-day EMA is diverging further from the 100-day EMA, signaling bullishness. Remaining above the Major Support Levels and the 50-day EMA would support a breakout from R1 ($1.2653) towards R2 ($1.2689). Conversely, falling through S1 ($1.2597) would bring S2 ($1.2577) and the 50-day EMA into focus, potentially sending a bearish signal if breached.


